EVE-NG Pro 6.4.0-50-PRO is out, and honestly—it’s one of those updates that makes you stop, lean back, and appreciate how far the platform has come – again!. Two big highlights stand out: Traffic Flow Visibility through real-time filters and a serious performance boost that makes large labs feel smooth, even on older hardware.
In my own JNCIE-DC lab, I’ve already noticed massive improvements not just in boot time, but in overall usability, troubleshooting, and understanding traffic flows – let’s break down what this Version has to offer and how we can use tis for our daily Labs 🙂 Anyone who’s spent hours chasing ghost traffic in a lab knows the pain: you configure a topology, but you can’t “see” what’s really happening inside the network. Packet captures are fine, but they’re static snapshots. You need live visibility. Traffic might leave a port but does it really arrive at the destination? And if not – where exactly did it “vanish”?
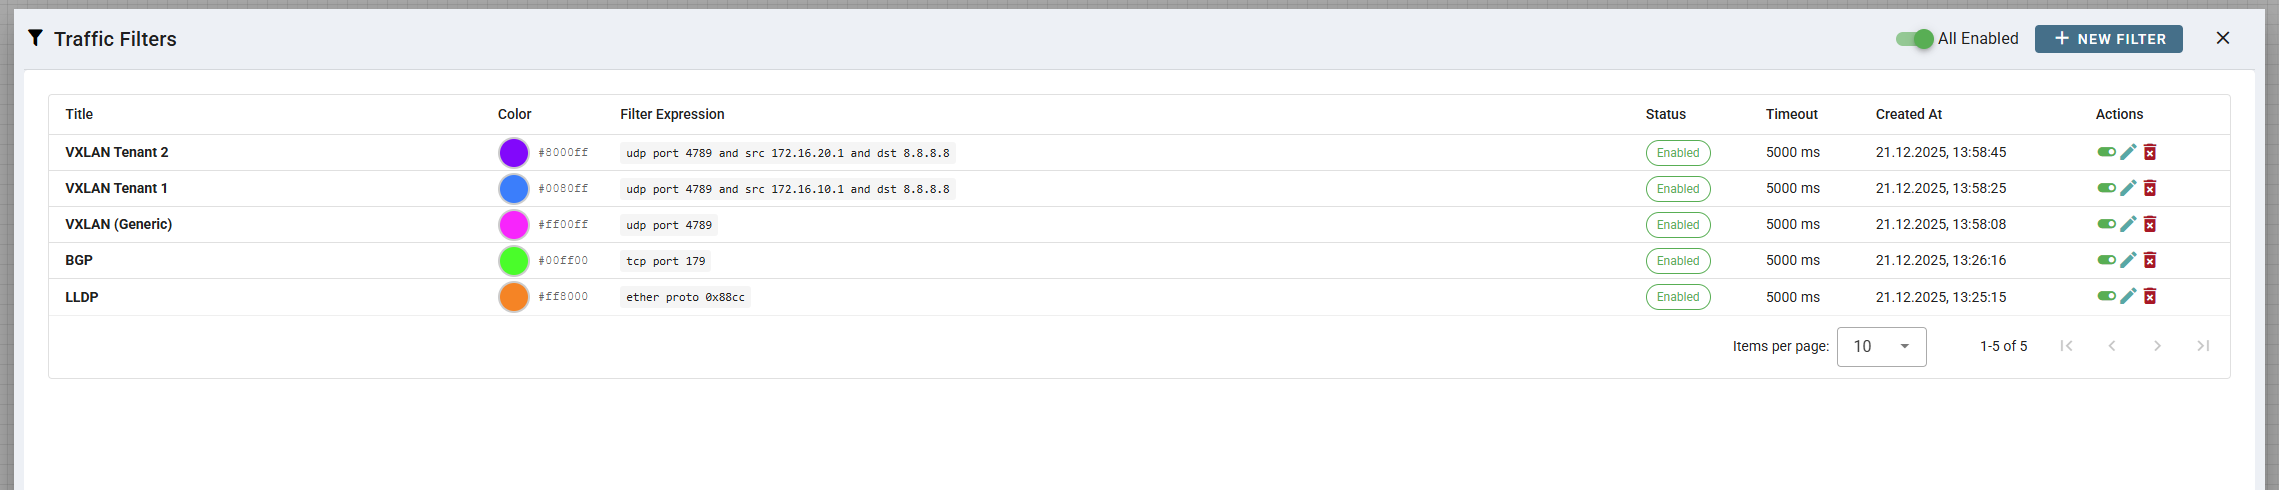
EVE-NG now offers live traffic filters directly in the UI. This means you can:
- Apply a filter
- See traffic flowing instantly
- Debug, explore, and understand protocols in real time
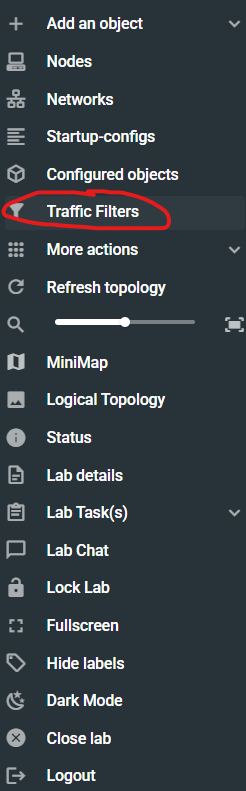
What You Can Filter
The filters are flexible enough to cover almost everything you’d normally do with tcpdump:
- VLAN / VXLAN (yes, now you can make your VXLAN visible)
- STP
- LLDP
- ARP / ND
- OSPF / BGP / IS-IS
- ICMP / TCP / UDP
- so much more!
This is a huge step forward for learning and demos. Suddenly, you can watch protocols interact, follow ARP or BGP updates, or see LLDP advertisements without spinning up Wireshark on each node – HOW FREAKIN AWESOME IS THAT??????
Here’s a small cheat-sheet for some (but by far not all) Filters:
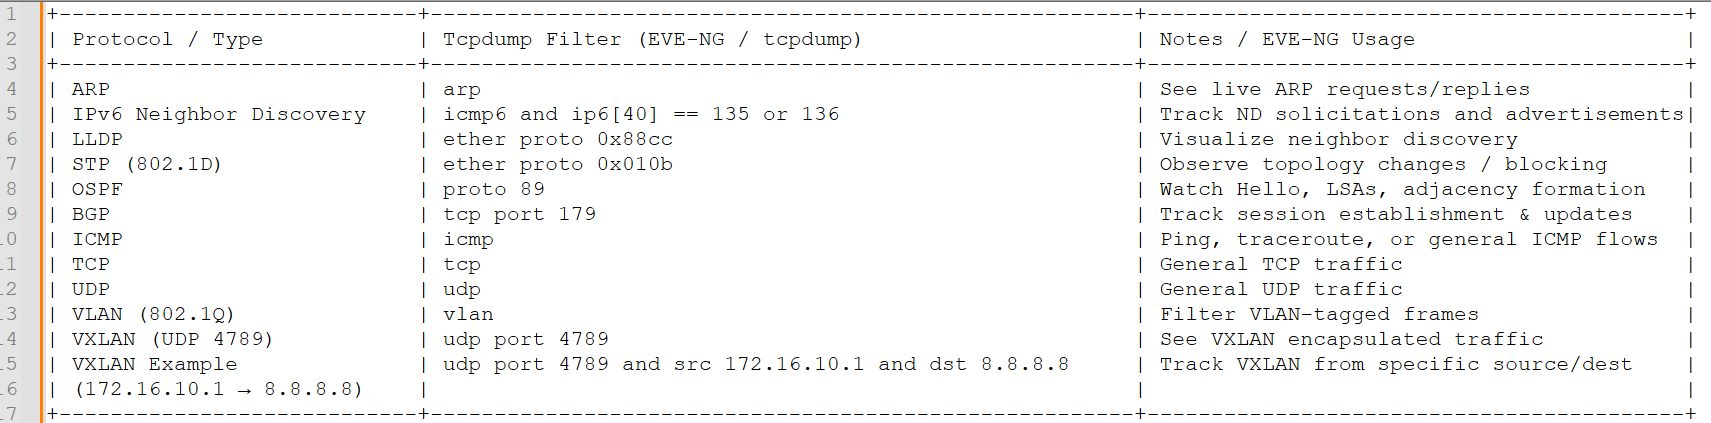
And here is the text so you can copy and paste:
| Protocol / Type | Tcpdump Filter (EVE-NG / tcpdump) | Notes / EVE-NG Usage |
|---|---|---|
| ARP | arp | See live ARP requests/replies |
| IPv6 Neighbor Discovery | icmp6 and ip6[40] == 135 or 136 | Track ND solicitations and advertisements |
| LLDP | ether proto 0x88cc | Visualize neighbor discovery |
| STP (802.1D) | ether proto 0x010b | Observe topology changes / blocking |
| OSPF | proto 89 | Watch Hello, LSAs, adjacency formation |
| BGP | tcp port 179 | Track session establishment & updates |
| ICMP | icmp | Ping, traceroute, or general ICMP flows |
| TCP | tcp | General TCP traffic |
| UDP | udp | General UDP traffic |
| VLAN (802.1Q) | vlan | Filter VLAN-tagged frames |
| VXLAN (UDP 4789) | udp port 4789 | See VXLAN encapsulated traffic |
| VXLAN Example (172.16.10.1 → 8.8.8.8) | udp port 4789 and src 172.16.10.1 and dst 8.8.8.8 | Track VXLAN from specific source/dest |
| ARP Requests Only | arp and arp[6:2] = 1 | Detect unresolved IP-to-MAC lookups |
| ARP Replies Only | arp and arp[6:2] = 2 | Verify ARP resolution success |
| Gratuitous ARP | arp and src host 0.0.0.0 | HA failover or IP takeover testing |
| ICMP Destination Unreachable | icmp[0] = 3 | Routing or firewall drop diagnosis |
| ICMP Fragmentation Needed | icmp[0] = 3 and icmp[1] = 4 | MTU and PMTUD troubleshooting |
| Traceroute (ICMP TTL Exceeded) | icmp[0] = 11 | Path inspection through the lab |
| TCP Handshake Only | tcp[tcpflags] & (tcp-syn|tcp-ack) != 0 | Connection establishment analysis |
| TCP Retransmissions (Heuristic) | tcp[tcpflags] & tcp-ack != 0 | Packet loss or congestion symptoms |
| TCP FIN / Session Close | tcp[tcpflags] & tcp-fin != 0 | Graceful session termination |
| Asymmetric Routing Check | tcp[tcpflags] & tcp-syn != 0 and tcp[tcpflags] & tcp-ack == 0 | SYNs without replies |
| DNS Queries Only | udp port 53 and udp[10] & 0x80 = 0 | Client-side name resolution issues |
| DNS Responses Only | udp port 53 and udp[10] & 0x80 != 0 | Validate DNS server behavior |
| DHCP Discover | udp[247:1] = 1 | Clients requesting an IP address |
| DHCP Offer | udp[247:1] = 2 | Verify DHCP server availability |
| HTTP GET Requests | tcp port 80 and tcp[((tcp[12] & 0xf0) >> 2):4] = 0x47455420 | Application-layer debugging |
| HTTP POST Requests | tcp port 80 and tcp[((tcp[12] & 0xf0) >> 2):4] = 0x504f5354 | API or form submission tracking |
| BGP Keepalives | tcp port 179 and tcp[32:1] = 4 | Verify BGP session stability |
| OSPF Hello Packets | ip proto 89 and ip[24] = 1 | Adjacency formation debugging |
| OSPF LSAs | ip proto 89 and ip[24] != 1 | Topology propagation analysis |
| VRRP Advertisements | ip proto 112 | Gateway redundancy testing |
| RTP Media Streams | udp portrange 10000-20000 | Voice quality troubleshooting |
| IPsec ESP Traffic | ip proto 50 | Verify encrypted VPN traffic flow |
| IPsec AH Traffic | ip proto 51 | Authentication header verification |
| IKE / ISAKMP | udp port 500 or udp port 4500 | VPN negotiation / tunnel setup debugging |
| MPLS LDP Discovery | udp port 646 | Label Distribution Protocol sessions |
| MPLS Ping / Labeled Traffic | mpls | Debug MPLS encapsulation / forwarding |
| EVPN BGP Type-2 (MAC-IP) Updates | tcp port 179 and tcp[32:1] = 2 | EVPN MAC/IP learning verification |
| EVPN Type-5 (IP Prefix) Updates | tcp port 179 and tcp[32:1] = 5 | EVPN routed overlay verification |
| Kubernetes API Requests | tcp port 6443 | Control plane access debugging |
| VXLAN Flood / BUM Traffic | udp port 4789 and (dst net 239.0.0.0/8 or dst ff:ff:ff:ff:ff:ff) | Troubleshoot broadcast, unknown, multicast replication in overlays |
| MPLS OAM / LSP Ping ICMP | mpls and icmp | Verify LSP continuity for MPLS troubleshooting |
| VXLAN ARP Suppression | udp port 4789 and arp | Check whether ARP suppression / VTEP learning works |
| MPLS Ping / ICMP over MPLS | ip proto 1 and mpls | Verify end-to-end MPLS reachability |
| BGP Route Refresh | tcp port 179 and tcp[32:1] = 5 | Force and debug dynamic route updates |
| VXLAN Multicast Join / Leave | udp port 4789 and ip multicast | Debug VTEP multicast replication |
| Overlay Control Plane (EVPN / BGP) | tcp port 179 and (src net 10.0.0.0/24 or dst net 10.0.0.0/24) | Focus on overlay control plane messages |
| Kubernetes Kubelet Node Traffic | tcp port 10250 or 10255 | Node agent communication inspection |
| Container-to-Container Pod Traffic | tcp and src net 10.244.0.0/16 | Verify pod network connectivity |
| Firewall NAT Translation Check | tcp and dst host |
Ensure NAT translation is correctly applied |
| Firewall Policy Hit | tcp or udp and src host |
Check which rules traffic matches |
| HA Cluster Heartbeat | udp port 702 | Cluster heartbeat for appliance HA |
| VXLAN BFD over VTEP | udp port 3784 | Check fast failover detection over overlays |
| Kubernetes NodePort Traffic | tcp dst portrange 30000-32767 | External access to NodePort services |
| Kubernetes Ingress Controller | tcp port 80 or tcp port 443 and dst |
Track Ingress traffic flow |
| VXLAN ARP / MAC Learning Verification | udp port 4789 and arp | Check whether VTEP learned MAC addresses correctly |
| BGP Flap / Route Withdraw | tcp port 179 and tcp[32:1] = 3 | Monitor BGP route withdrawals |
How I’m Using It in the Lab
In my JNCIE-DC lab, EVEs traffic filters have changed how I interact with the topology. Watching VXLAN traffic flow across multiple switches as tenants power up is almost meditative—like seeing the network breathe. I can follow OSPF LSAs in real time, watch adjacency formation, and understand exactly when and why routers decide to talk or stay silent. BGP updates? No need to juggle packet captures or spend five minutes opening Wireshark on every router; it’s all visible instantly in the UI. I can literally sit back with a cold cola (or a warm Tea) and watch the control plane dance. Filters don’t just make traffic visible – they turn our labs into interactive learning environments. For example, I can isolate just the ARP chatter on a VLAN, follow LLDP advertisements hop by hop, or even watch STP recalculations when I deliberately tweak a link. It’s like turning a foggy glass window into a clear pane: suddenly, the cable is transparent, and everything is visible – like a doctor using contrast medium to follow your blood-flow in your body – now we can color our traffic in the same way and watch our organism come to life 🙂 And here’s the best part: you can combine filters. Want to watch OSPF between two routers while ignoring all the other noise? Done. Curious about how VXLAN encapsulates an inner IP while STP keeps your topology sane? Also done. You can focus on exactly what matters, without being overwhelmed by the thousand other little packets your lab throws around.
Here’s an example with LLDP and a timeout of 5000ms (shows the Link for 5s in the desired color):
And the very same example with 1000ms (shows the Link for 1s in the desired color):
I’ve also created a small youtube Video showing the different timeouts: https://www.youtube.com/watch?v=kjVrC9gtb_w
For demos, PoCs, or training sessions, this is gold. You can highlight traffic visually, show the audience exactly what’s happening, and explain the “why” behind the protocols instead of just the “what.” Teaching BGP path selection, VLAN segmentation, or even simple ARP behavior becomes interactive and intuitive. Instead of staring at a frozen topology diagram, learners see traffic actually moving, forming relationships, and responding to changes in real time. And for those messy labs where multiple protocols are overlapping? The filters cut through the chaos like a lightsaber. You know I’m a huge fan of MIST but this new Feature makes even MISTs visibility look like kindergarden while EVE is the University 😉
Honestly, using filters in EVE feels almost like cheating – but in a good way. You don’t have to guess, wait, or dig through captures anymore. You see everything, live, and it finally feels like your lab is alive, not just a static simulation. Once you start using these filters, it’s hard to go back to “blind packet capture” mode. And boy am I cursing at every vendor that something like this would make SO MUCH SENSE in EVERY management solutions our vendors have to offer. You all can learn a LOT from EVE-NG 😛
Now for the other (almost invisible part) of this update:
While traffic visibility is the headline, the performance improvements are just as important and stunning if you ask me.
In my testing I checked a post from Alain saying:
- 📉 CPU usage dropped by ~60%
- 📉 Database queries decreased by ~80%
- 🖥️ The UI stays responsive even with large labs
And the best way to test the claims: My huge SSB JNCIE-DC Lab (Superlab 1 and Superlab 2)
Or how my EVE calls it: The Lab of RAM and CPU torture 😉
My JNCIE-DC lab is notoriously heavy as you might know. We’re talking dozens of switches and routers, all demanding CPU, RAM, and a bit of a sacrifice of tears, sweat and blood (okay, maybe not that drastic but still very demanding). These nodes are extremely resource hungry – so much so that for this lab, I strongly recommend using the vLabs, especially if you want to avoid waiting around while your hardware handles everything. And, of course, part of the reason is the holy vQFX grail version, which remains top secret (if you know, you know).
Booting this topology used to take its time. Power everything on simultaneously, go make a tea, maybe a sandwich, and you’d still be watching consoles slowly come online. But the real game-changer with EVE-NG 6.4.0-50-PRO is the dramatic performance boost. Boot time for my entire lab dropped from 30+ minutes to under 20, and navigating the UI is smooth, responsive, and downright enjoyable. Scrolling through the topology, clicking nodes, or opening consoles—everything keeps up with me. The mini-map from the last version remains a lifesaver, and now it actually feels instant and responsive, which makes managing large labs even easier. Many folks might miss this because the spotlight is on the Filters and they are a gamechanger for sure – don’t get me wrong. But it’s always mindblowing for me how the team acheives such massive improvements over and over again – it’s just awesome! This isn’t the first time the Team managed to massively impress me and others and I bet it sure wasn’t the last time 🙂 HUGE CONGRATS for another impressive Version guys – YOU ROCK!
Of course, I had to push it further. I powered up a nested vJunos-Switch on an EVE-NG VM (yes, I will probably go to hell for this) running on my DL380G8 with standard HDDs – no SSD (yes, such Servers still exist), no template tweaks. Up until today, this would always fail mid-boot, and I assume (just my guess) that the nested VM lost too much performance along the way. But now? I powered it on, waited a few minutes, and BOOM—vjunos-Switch nested perfectly, running 24.4R2-S2 (from Juniper’s official support downloads). It’s still not instant, but it actually finishes booting now and is actually useable after it booted up, which was impossible before. Even my older servers, the DL380G8 and DL380G9, feel noticeably snappier. Tasks that used to feel “heavy” now respond fluidly, and the UI doesn’t stutter, even with dozens of nodes powered on. Large labs are still large, but interacting with them finally feels natural and enjoyable. And these seemingly “small” changes make a huge overall impact – at least for me personally.
6.4.0-50 isn’t just about new features – it’s about real improvements in performance and usability. Nested environments, heavy topologies, and even older hardware now benefit from faster boot times, responsive navigation, and a UI that keeps pace with your lab work. For anyone deep in DC lab environments or preparing for any type of JNCIE, CCIE or any other heavy lab, this update feels like a breath of fresh air – it’s smoother, faster, and finally lets you focus on the experiments rather than worrying about performance quirks.
If you’ve been on the fence about upgrading, this is the version to jump on (well actually 6.4.0-54 – an update has arrived while I was sitting here and writing this). For anyone serious about lab work, certification prep, or network demos, it’s a noticeable difference – both in how fast your labs run and in how visible your traffic really is. And yes – it’s just for the PRO Edition (not community) but that’s more than fair as I suspect that significant resources were needed to make this happen.
All my Proxmox fellas will be happy to hear that the new cookbook has landed, and it’s packed with goodies. It walks you through installing EVE-NG on Proxmox step by step, from a fresh VM to a fully working lab environment, making sure even nested setups behave nicely. It also has a new chapter about the Traffic filters 🙂
In my next Session with Juniper Open Learning on January 8 (Register here) I will show this feature live 🙂 So if you’ve always wanted to know how to setup Juniper EVE-NG Labs and what you can do – feel free to register even if you can’t make it – all registered folks will receive the recording! In Session 3 (Feb 2026) we can come up with even more advanced filters 🙂
Many new posts will follow in 2026 – because so far the Feature is new and I’m sure myself and others will come up with so many clever ways to use the filters – this will be fun 🙂 Happy Holidays folks – stay safe and enjoy labbing.
Pingback: permit-any-any.comTraffic Flow Visibility Hits EVE-NG 6.4.0-50-PRO